Good evening from Southern Connecticut Weather!
June 1st is a big day in weather for a variety of reasons. First, today is the start of Meteorological Summer, which is our way of defining the four seasons for record keeping purposes. Interestingly, with the earliest possible Memorial Day this year and the latest possible Labor Day coming in September, psychologically this will be the longest "summer" we will have on the calendar in quite some time!
Of course, real summer begins in about three weeks. The days are getting longer, our climate normals are rising, and with the start of June we move into the middle of the calendar year. This is also the start of the 2026 Atlantic Hurricane Season.
This is as good a time as any to look back at the winter and spring that defined the first half of 2026, and take a look ahead at what we're thinking for summer. With a significant El Nino event increasingly likely in 2026, let's take a look at what that could mean for Connecticut's weather moving forward.
Let's dive in!

Above: Winter and Spring 2026 in Connecticut. Images taken at Great River Park in East Hartford.
The Winter That Was
After an incredible stretch of non-winter winters for most of the 2020s, we returned to the winters we used to know in New England this year. Cold and snowy.
Let's talk cold first.
Winter Temperatures
Let's start with what we wrote in our winter forecast. We thought that a potentially strong El Nino would lead to a warmer than normal winter, but not overwhelmingly so.
Temperature Forecast
December: 1 to 2 degrees above normal
January: 1 to 2 degrees above normal
February: -.5 degree below normal to 1 degree above normal
Winter Composite: 1-2 degrees above normal
Boy, were we wrong. If we were grading this part of the winter forecast it'd be an F. The strong Nino didn't materialize--it was delayed but won't be denied--and until the bitter end, Winter 2025-26 was defined by a return of true cold, which brought repeated Arctic blasts that dropped the state below zero on multiple occasions and into the single digits frequently.
At Bridgeport, this was the most days with lows below 10 degrees (7) since 2017. It had the most days with highs below freezing (19) since the exceptionally cold winter of 2014. Impressive numbers, but nothing outrageous or unique.
Inland however was a bit of a different story. At Hartford (BDL), this was the most days with lows below 10 degrees (21) since 2014. That's only the fourth time we've seen 20 or more winter days that cold this century, and just the ninth time since 1970!
BDL also had the most days with highs below freezing (31) since the exceptionally cold winter of 2014. For a time, BDL was running the coldest in at least 30 years in terms of overall winter temperature, until the thaw at the every end moved us out of that territory.


Above, winter statistics on BDR and BDL in chart form. You'll notice that the 1960s through 1980s were very cold for us.
Overall, it was a very cold season relative to today's warming climate norms, but not as cold if you grew up in the 60s to 80s.
Overall, it was a very cold season relative to today's warming climate norms, but not as cold if you grew up in the 60s to 80s.
 |  |
Above: Using the 2025-26 overall winter temperature you can see that what was frigid by today's standards in the east would have been near normal during the 1961-1990 climate period. Climate periods last 30 years to provide as much data as possible on shifting climates that happen over time and has accelerated in the warmer direction in recent decades.

Winter Precipitation
Here, we thought that we'd end up with a "near to slightly above" precipitation winter, and while not as bad as the temperature forecast, it was still a pretty dry winter.
Precipitation Forecast
December: 100% to 120% of normal
January: 90% to 110% of normal
February: 90% to 110% of normal
Winter Composite: 90% to 110% of normal
Overall, we ended with precipitation--that is the liquid number of everything that fell--between about 70-80% of normal. Although we had two big storms, we had too many dry periods that kept us below the forecast. If I were grading here, it'd be a B at best.
As bad as it was for us, it was far worse in other parts of the region.

Winter Snowfall
Now for what everyone cares about, snowfall. If you recall, we kicked the season off with a map of what we thought seasonal snowfall would be. Some interpreted that to be a forecast for a single storm, which led to quite a bit of side-eye and plenty of laughs.
Snowfall Forecast
December: 50% to 70% of normal
January: 80% to 100% of normal
February: 100% to 120% of normal
March: 80% to 100% of normal
Winter Snowfall: 80%-100% of normal across Connecticut

Well, things got interesting real fast in December, with a winter pattern that set in almost immediately and continued on through one mini thaw in early January and the thaw to end February. We had two big storms, which ended up being high end and historic storms for much of the eastern U.S. in January and February. That led to a fascinating (and I'd guess rare) snowfall distribution where southern CT went well above normal in snowfall, while central and northern CT ended up right near average.
Below you'll see that for much of coastal CT you were 20" or more above normal while in northern CT you were right around normal.
Below you'll see that for much of coastal CT you were 20" or more above normal while in northern CT you were right around normal.

So while it was very snowy in southern CT, in northern CT it was an average snowfall winter. You can see this even clearer in the images below.
First, let's look at Bridgeport. It finished the 2025-26 season with 55.9" of snow! The blue line is the record winter of 1995-96 which had 73.1" of snow. The red line is this past winter. The Black dotted line is average. After that January bomb Bridgeport was locked for an above normal snowfall winter, but only slightly so. After the first bomb you had a period of virtually nothing and then BOOM!
The second bomb put you past the all-time record pace briefly, but after that later February storm there was nothing else. Incredible season along the coast.

But let's contrast that with BDL, which normally is the snowier spot outside of the hill towns.

The very first thing you'll likely notice is how much less above normal the red line is compared to Bridgeport. Some of this is optical illusion--there is much more of a ceiling for snowfall in northern CT compared to the coast (the record is nearly 40" greater than Bridgeport's record)--but Bridgeport beat out BDL by a hair on snowfall overall. Note the second bump on the red line compared to Bridgeport. While the coast cashed in on that February storm, interior CT did not nearly as much. In fact, the northern CT River Valley was the "sucker zone" for that February storm. Small things can make a big difference when we're tracking snow.
So while the forecast along the coast for winter snow was a bust, it was actually not too bad inland. Still, probably only good for a C+ given how well southern CT did.
Our pretty "normal" winter was pretty wild.
So while the forecast along the coast for winter snow was a bust, it was actually not too bad inland. Still, probably only good for a C+ given how well southern CT did.
Our pretty "normal" winter was pretty wild.

Above: An extraordinary satellite image showing snowfall across the eastern U.S. on February 1, 2026. Most of this in New England came from the Blizzard of 2026 in January, which ranked top 5 in the modern era (dating back to 1956) by NOAA for impact across the country. Looking at the snowfall analysis below you can see why. A second storm (pictured here) brought historic snow to the Carolinas.

Meteorological Spring
There's not as much to say about spring, because it wasn't terribly active! Spring tends to be our quiet period, and for the most part, we had that this year. But how we moved through spring was very interesting.
Much like Meteorological Winter (Dec-Feb), Meteorological Spring (Mar-May) got off to a quick start in the sense that snow chances really diminished after the February bomb and the deepest cold backed off. But the pattern that established itself in the winter of frequent cold blasts continued.
Spring Temperatures
Outside of SE CT, the last three months that made up spring were slightly above normal. That however, is an example of numbers diverging from how we experienced the season.
Recall that we had a few 90 degree stretches this spring. Cold temperatures overwhelmed those anomalies when you look month by month.
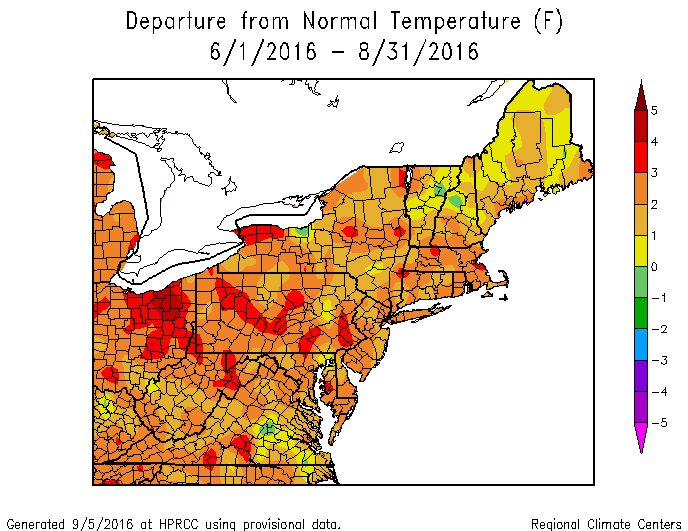
Above: Overall Meteorological Spring temperatures. Right at normal in SE CT while it was slightly warmer than normal in the rest of the state.
Our very cold February was replaced with a warmer March.
Our very cold February was replaced with a warmer March.


At Bridgeport, the warmest day of March was 72, and that was on the last day of the month.
April meanwhile was barely above normal at the coast, with Bridgeport squarely within the normal range with a +0.7 degree departure. In interior CT, where we had our first stretch of upper 80s to low 90s, the departure was +2.2. At BDL April 14 to the end of the month brought three days with highs above 85. In that same period, there were six days with highs in the 50s or colder.
Buckle up for May.
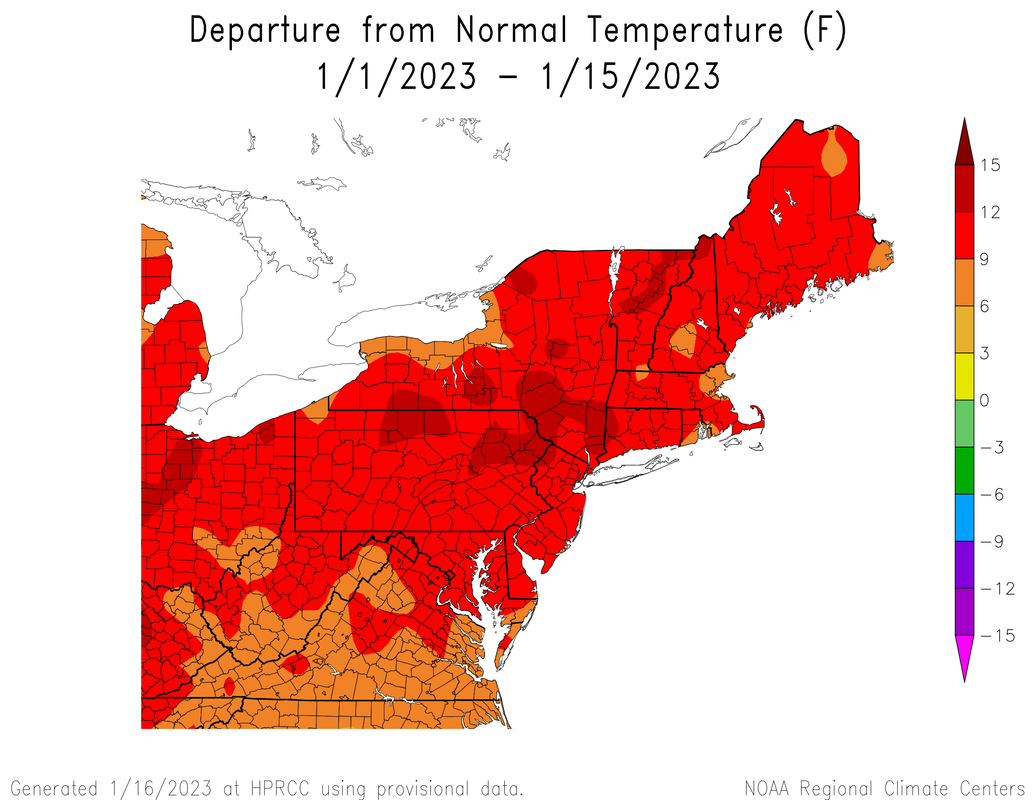
Somehow our cold intrusion pattern became even more pronounced in May, with most of the state finishing the month below normal! This happened despite our first heat wave of the year occurring at BDL, which lasted four days and included a 96 degree day. How do you get a big warm up like that and still end up below normal?
At BDL 19 of 31 days finished below normal. At Bridgeport, you finished almost dead center of normal at +0.3 degrees overall.
Spring Precipitation
Spring was almost exclusively rain this year. The frequent troughs that brought the cold also brought rain, though not as much as you'd think.
At BDL 19 of 31 days finished below normal. At Bridgeport, you finished almost dead center of normal at +0.3 degrees overall.
Spring Precipitation
Spring was almost exclusively rain this year. The frequent troughs that brought the cold also brought rain, though not as much as you'd think.
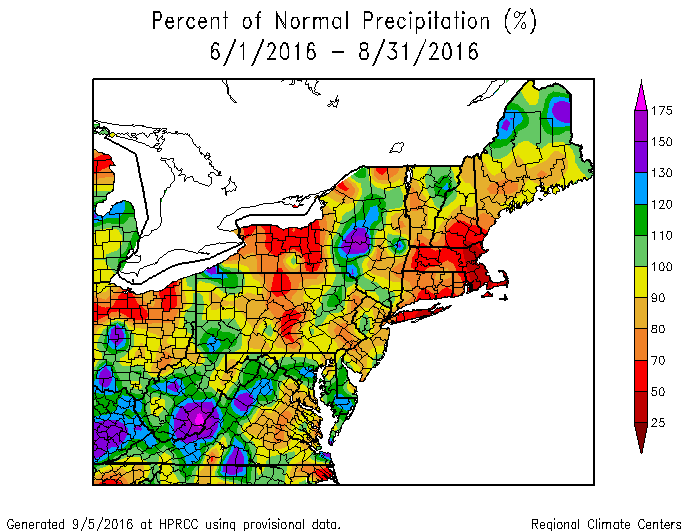
There was more rain, but not nearly enough. Fortunately, our wetter winter relative to other areas has us in somewhat better shape than our neighbors to the east and south as we head into summer, but we need more rain.
Here's the total of precipitation since the start of Meteorological Winter six months ago.
Here's the total of precipitation since the start of Meteorological Winter six months ago.

Overall, this means that we are behind between about 3-6" of rain from where we should be at this point in the calendar year.

Despite the deficit, this is not enough to put us in a significant drought, and soil moisture levels aren't particularly bad at this time. That could change if we have extended dry periods, which look unlikely at the moment.

Above: The latest drought monitor release, which has improved overall and doesn't show the most recent rainfall from the past weekend.
Ok, we've looked back in great detail, but now summer is here. How do things look moving forward? How will the developing El Nino impact our weather?
Summer 2026 (and Beyond)
The big elephant in the room for our summer is the developing El Nino. After years of a La Nina global regime, we have a quickly developing (on the official timescale) and gradually strengthening (using current observational data) El Nino.

Two things that stand out in the image of sea surface temperature anomalies above. The first, which may be easily spotted by you is the warmth off the South American coastline. That's a classic El Nino signal. The second, which may not be as easily spotted, is the warmth in the Pacific compared to the cooler anomalies in the Atlantic. El Nino suppresses Atlantic hurricane activity, and this looks like as close to a slam dunk below normal season as I've ever seen in the Atlantic, though tropical systems will still form.
Setting aside tropical season, let's talk temperature and precipitation. The coming El Nino is likely to officially develop in the next 60 days. The Climate Prediction Center (CPC) gives it an 82% chance.
For the winter lovers among us, it also gives a staggeringly high chance of 96% for it to be around during the coming winter.

Above: CPC probabilities of El Nino conditions existing for three month periods all the way through February 2027.
Just as important as whether there is a El Nino, La Nina, or neutral conditions, is the strength of a Nino or Nina. There are very high odds that this eventually becomes a strong Nino, with a rising chance that this is historically strong.
Just as important as whether there is a El Nino, La Nina, or neutral conditions, is the strength of a Nino or Nina. There are very high odds that this eventually becomes a strong Nino, with a rising chance that this is historically strong.

As you can see above, the odds of a strong to very strong Nino are actually higher later in the year, meaning that our JJA (June, July, and August) is likely to be under the influence of a weaker El Nino.
One of the misconceptions out there is that a strong to historic Nino means that there is strong to historic weather everywhere. There will likely be extremes in parts of the globe and country, but that's not much different from many years.
That said, we're not expecting a strong Nino during the summer months, so here's what we think things will look like assuming a weaker to moderate El Nino.
Summer Temperatures
We can't lose sight of the fact that our summers have become warmer, especially when you factor in the humidity, so let's talk about it. It's no surprise that if you look at longer term data over the decades, the shoreline is more humid. In that region you have closer access to marine influences, and while that may take the edge off the air temperatures most days it pumps more moisture into the air. The rate at which the average summer dew point has risen is happening fastest at the coast.
Since the mid 1990s in particular we've seen a quickening pace of higher humidity summers which has only accelerated since the mid 2010s at the coast.

For inland areas, where a combination of downsloping in the valley on hot days that BDL sits and less proximity to marine influences from a southerly breeze on a standard warm summer day, the humidity has been rising, but not nearly to the same degree.

Note how in the early 2000s it was increasingly humid at BDL followed by a decline in the 2010s and now new increases in the 2020s. This speaks to how geography and smaller scale features can have an impact on an annual basis, even when the overall trend is the same as in southern CT. No matter where you are in CT, if you remember summers as being more humid as they were back in the day, you're right.
My expectation is that it will be another humid summer, with frequent periods of dew points in the humid (above 65) range.
As for temperature, warmer than normal seems more likely than not, especially given how the overall temperature regime from Meteorological Spring 2026 played out, but that alone should tell you that we're likely in for seesawing temperatures.
During a strong Nino, which again, is unlikely this summer, there's typically not an extreme temperature regime either way. The sample size is small here but looks at strengthening El Nino events in 2015 and 1997. That's key because our Nino will be in the strengthening not weakening phase in 2026.
This small sample size shows big troughing across the continental U.S., but this is unlikely.

What we're looking at is a weaker atmospheric response. Here's what the analogs for a weak to moderate Nino since 2009-10 have looked like.

This image above looking at rising weak to moderate Ninos in the recent past shows a far less pronounced cold signal, with near normal temperatures in New England. This look would continue troughing periods in the east, which is consistent with Nino summers. Our persistent pattern may go on for longer yet.
Summer Precipitation
Now, this doesn't speak to the potential of severe weather, though if we do have periods of warmth and strong troughs running into warm and humid conditions we could have an active summer. The troughing signal for temperatures above makes me think that we continue to get wetter.
If the analogs are anywhere near correct it could be quite wet.

I don't think we're anywhere near this wet, but this raised my eyebrows when I plotted the base years above. I think overall the summer is near to just above normal in precipitation.
Overall
If we continue on the path we've seen this year and inject a rising weak to moderate El Nino, I anticipate a slightly warmer than normal summer with continued occasional blasts of colder air from the north, along with a near to just above normal season in rainfall. I think that probably means some good thunderstorm activity during the peak heating season in late June through July, but that's speculative. Even though I expect a quiet hurricane season, it only takes one to cause a problem, and even remnant systems can bring significant rainfall. Just one of those, like the big winter bombs we had, would blow open the precipitation forecast.
What does a strong Nino mean for Winter 2026-27?
The real answer is that it's way too early to know, but for the winter lovers among us, let's take a look at what a strong Nino, which currently stands at 2/3 odds of being in place by winter, tends to mean in temperature and precipitation. Unlike the plots above, these Nino events were peaking or falling during the winter, which is likely what we'll see this winter as well.


That's not a great look if you like winter in the east, but hey, summer just started.
As always, please like, share, and interact with us on our social media--on Facebook to share our discussions, and follow us on Twitter @southernctwx to retweet our posts. Hit the buttons below to join.
Thank you for reading SCW.
-DB
As always, please like, share, and interact with us on our social media--on Facebook to share our discussions, and follow us on Twitter @southernctwx to retweet our posts. Hit the buttons below to join.
Thank you for reading SCW.
-DB
